Sunday, February 23, 2020

Oral Presentations


Oral Presentation

Students, you will have 8-10 minutes to complete your oral presentation to the judges. Ensure you have introduced yourself, briefly explain your topic, and define key words or terms you will use throughout. You need to make sure you have stated your hypothesis or question and answer.

In your conclusion, ensure that you have stated your answer to your question. It does not matter if you were research or experiment! Lastly, you must conclude with what you will do now after your experiment or research.

Be prepared to answer questions :) 


Friday, February 21, 2020

Science Fair Expectations


PRIOR to Science Fair all projects and passion projects must have...

1) rehearsed their presentation
2) Ensure they have all the components in their display, tri-fold, slides, etc
3) Go over judging rubric (experiment or research)
4) Figure out who is bringing the project to school either Monday afterschool or Tuesday morning

Feb. 25th is our Science Fair below are your instructions

CITY SCIENCE FAIR STUDENTS ONLY IN THE MORNING TO BE JUDGED FROM 9:30AM-12PM

Tuesday Morning

(before 9:10am)
-Drop off your projects
-Go to your classroom for attendance
-Grab work that you can work on throughout the day

9:30am
-Judges have a walk around

9:45am - 12:00pm
-Judging begins
-1 teacher supervises
-Students not being judged are expected to remain quiet, working on their work from class, and stay at their tri-fold the whole time. Ask for permission to leave by raising your hand.
-Signing Thank you cards for your judges

12pm - 12:10pm
-Clean up for lunch (moving tri-folds to the side)

1:05 - 1:15
After Lunch Instructions
-Stay for PM attendance
-PASSION PROJECT & CITY SCIENCE FAIR COMPETITORS IN THE GYM
-Leave to go back to the gym to set up again

1:15 - 3:30 

GENERAL PUBLIC & CLASSES VIEW 
-Presenting your projects

3:30-3:50pm
-Clean up (EVERYONE HELPS)

The winners will be announced at a meeting during lunch on Wednesday. 

GOODLUCK EVERYONE :) You've done an amazing job! We are very proud of you-Sincerely your Science Fair Coordinators

Wednesday, February 5, 2020

Passion Projects Update


PASSION PROJECT UPDATE

Stay tuned for the date when Passion Projects will be presented. They will most likely be during the last week of February. Thank you for your patience and enthusiasm Science Fair Club!

Trifold Updates!


Tips & Tricks on your Tri-fold


  1. Don't wait until the last minute. A great board takes time to put together, and students can work on sections of the board even before the project is complete. 
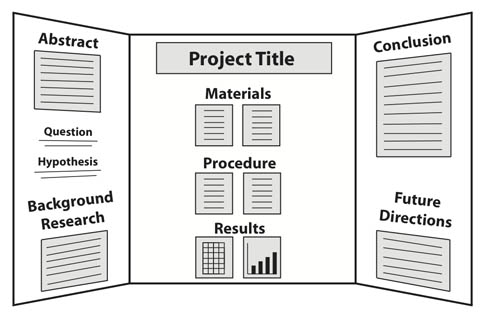
  2. storyboard your display boardStoryboard the display board. On a blank sheet of paper, block out the sections you will include and where they will go. This will help you determine how best to fill the space, help you decide what to include, and serves as a blueprint for assembling the board sections.
  3. Use the steps of the scientific method or engineering design process as a guide. The stages of a student's project can be used to help prepare and organize the sections of the display board.
  4. Make use of headers. The title, headers, and even subheads help a user make sense of the material on the board at a glance.
  5. Pay attention to the assignment. Teachers may request certain project components be included on the board, so be sure and check any rubric or assignment sheet provided.
  6. Be careful to ensure the elements on the board are readable. Headlines and titles should be readable at a distance. There is plenty of space, so larger fonts work well. 
  7. Use visual elements to grab attention. Headlines, photos, charts and diagrams, borders, trims, and even background design elements related to the project can help draw attention to your board. 
  8. Be neat. A well-executed display board is neatly done, contains printed sections (not handwritten), and shows care and organization.
  9. Show off your exciting project!

Science Fair Project Display Board Checklist

What Makes for a Good Science Fair Project Display Board?For a Good Science Fair Project Display Board, You Should Answer "Yes" to Every Question
Does your display board include:
  • Title
  • Abstract
  • Question
  • Variables and hypothesis
  • Background research
  • Materials list
  • Experimental procedure
  • Data analysis and discussion including data chart(s) & graph(s)
  • Conclusions (including ideas for future research)
  • Acknowledgments
  • Bibliography
Yes / No
Are the sections on your display board organized like a newspaper so that they are easy to follow?Yes / No
Is the text font large enough to be read easily (at least 16 points)?Yes / No
Does the title catch people's attention, and is the title font large enough to be read from across the room?Yes / No
Did you use pictures and diagrams to effectively convey information about your science fair project?Yes / No
Have you constructed your display board as neatly as possible?Yes / No
Did you proofread your display board?Yes / No
FONT SIZE


Yes / No
  • Use a font size of at least 16 points for your main body text. Anything smaller is too hard to read. (See the following tables for more information on text size.)
  • Stick with traditional fonts like ArialTimes New Roman, or similar typefaces.
  • Use italics or bold for emphasis, not for all your text.
  • Don't place your text on top of a picture; that makes it difficult to read.
  • Don't use ALL CAPS; THEY ARE MUCH HARDER TO READ.
  • Don't use reverse type (white text on a dark background).
    It is hard to read. Use black characters on a white (or pastel) background.
  • The words

    They are much harder to read.
  • Don't use more than two or three different fonts on your board. Times New Roman for body copy and Arial for headings makes for a nice combination.

Data Table


DATA TABLE 
A data table is a group of related facts arranged in labeled rows and columns and is used to record information. Its purpose is to help sort, analyze and compare data gathered from a science experiment or research project. Knowing how to create a data table demonstrates skills in organizing information in a meaningful way and provides a learning base to progress to more sophisticated ways to track data.


Title:
The title describes the variables and what is being measured. If you are constructing a data table comparing different types of activities on heart rate, your title would read “The Effect of Different Physical Activities on Heart rate”
Measurable Unit:For the data table to have meaning, use a measurable unit to compare the two variables. Examples of measurable units would be time (hours, minutes, seconds), length (centimeters, inches, miles) or degrees (Fahrenheit, Celsius). In our example, we are comparing the effect of four different types of activities on heart rate, so we would use beats per minute as our unit of measure.
Repeated Trials:When comparing the variables, include at least three trial runs for each activity. Conducting more than one trial helps you to find an average and reduces the possibility of experimental error. For example, measure the heart rate for “walking” at least three different times. After completing three “walking” trials, total the heart rates, then divide it by three (or number of times you did the trials) to get an average heart rate for the walking activity. Repeat this step for each activity.
 

Data Analysis & Graphs


DATA ANALYSIS & GRAPHS
Graphs are often an excellent way to display your results. In fact, most good science fair projects have at least one graph.

  • Review your data. Try to look at the results of your experiment with a critical eye. Ask yourself these questions:
    • Is it complete, or did you forget something?
    • Do you need to collect more data?
    • Did you make any mistakes?
  • Calculate an average for the different trials of your experiment, if appropriate.
  • Make sure to clearly label all tables and graphs. And, include the units of measurement (volts, inches, grams, etc.).
  • Place your independent variable on the x-axis of your graph and the dependent variable on the y-axis.

For any type of graph:
  • Generally, you should place your independent variable on the x-axis of your graph and the dependent variable on the y-axis.
  • Be sure to label the axes of your graph— don't forget to include the units of measurement (grams, centimeters, liters, etc.).
  • If you have more than one set of data, show each series in a different color or symbol and include a legend with clear labels.
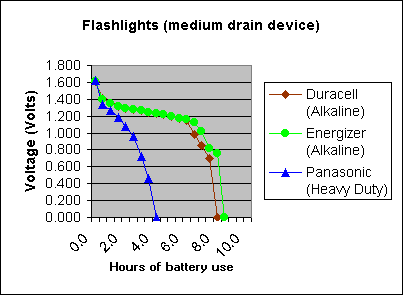
Example line graph shows the voltage of three different batteries over time

Different types of graphs are appropriate for different experiments. These are just a few of the possible types of graphs:
bar graph might be appropriate for comparing different trials or different experimental groups. It also may be a good choice if your independent variable is not numerical. (In Microsoft Excel, generate bar graphs by choosing chart types "Column" or "Bar.")
A time-series plot can be used if your dependent variable is numerical and your independent variable is time. (In Microsoft Excel, the "line graph" chart type generates a time series. By default, Excel simply puts a count on the x-axis. To generate a time series plot with your choice of x-axis units, make a separate data column that contains those units next to your dependent variable. Then choose the "XY (scatter)" chart type, with a sub-type that draws a line.)
An xy-line graph shows the relationship between your dependent and independent variables when both are numerical and the dependent variable is a function of the independent variable. (In Microsoft Excel, choose the "XY (scatter)" chart type, and then choose a sub-type that does draw a line.)
scatter plot might be the proper graph if you're trying to show how two variables may be related to one another. (In Microsoft Excel, choose the "XY (scatter)" chart type, and then choose a sub-type that does not draw a line.)


Friday, January 17, 2020

Science Fair Presentation Day!

Science Fair Presentation Day!

We are so close to finishing our projects for our Science Fair Day. Students who are competing in cities (gr. 5/6) they will have a full day of judging in the morning, and then presenting to their peers in the afternoon.
Our date will be most likely Tuesday February 25th

Students who have completed a Science Passion Project will also have a time for presenting please keep looking to the blog for further information on this.

Everyone's work will be celebrated!


Tri-folds
Tri-folds have arrived. If you have ordered a trifold you must speak to a Science Fair Coordinator in order to  tell them when you will be picking it up. Communicate with your partner if you have one as to who will be taking it. Then communicate with your parents as to how and when you are getting it! Tri-folds CANNOT be transported on the bus.
Science Fair Coordinators can give out tri-folds before 9:10am and after school. If your parents arrive at the school, have them notify the office and a Science Fair Coordinator will be called down to meet them.